
A Summary of Information on Global Economy in 2013
The global economy was stable in the first half of 2013. Most people hoped a faster expansion in the second half; unfortunately, the growth has slowed indeed in the third quarter. The GDP growth were expected to be 3.2% for 2013 and 3.6% for 2014; the figures were 4.0% for 2011 and 3.2% for 2012. This week, the International Monetary Fund lowered the outlook of global economic growth for 2013 and 2014.The following table lists the gross domestic production of major economies:
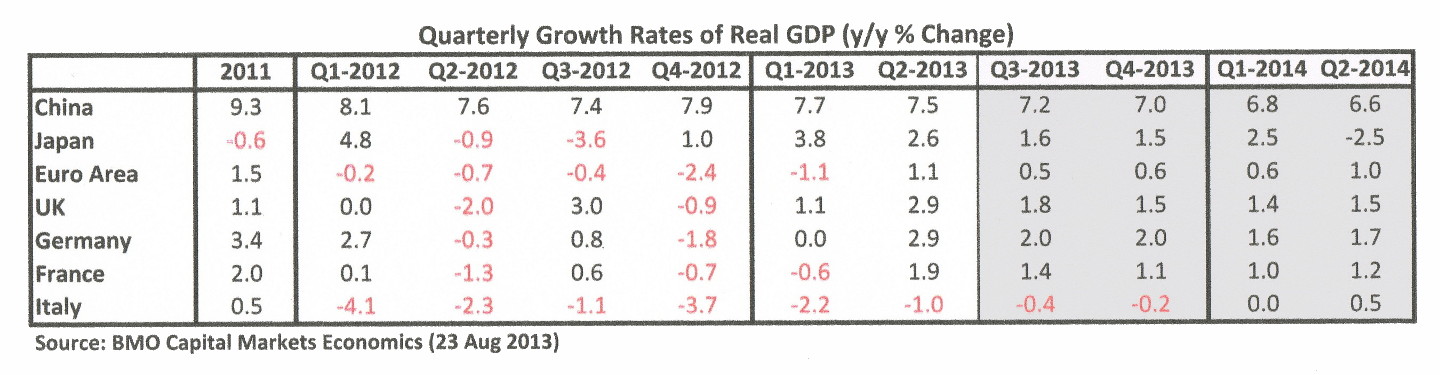
Table 1. Real Gross Domestic Production (GDP) of Major Economies, 2010 — 2014 (shaded boxes show estimates)
At this moment, almost all major economies have emerged from the recession. The Eurozone has the largest economy that now grows again. It is still weak with four of its 17 members lagging
in recession, including Italy and Spain, but the situation is not bleak at all. Portugal showed a strong second quarter with a 1.1% growth rate (4% annualized) and ended a 2.5-year recession; even
the recession of Greece might have bottomed out with a smaller 4.6% contraction in the second quarter and Greece finance minister predicts a positive growth next year.
At this moment, the United States seems to have resumed the driving role again in the global economy,
with a slow but steady pace in its recovery, for example higher employment and industrial production levels. It is worthwhile to note that the United States is becoming the biggest energy producer
while China has become the biggest energy consumer in the world.
China's growth rate has been noticeably slowed down in recent quarters. It is not the hard-landing that western analysts fear, but probably a controlled strategy by the central government to tame its high-flying economy and to transit China from an export-led manufacturing economy to a domestic consumer-driven economy. East of China Sea, Japan showed strong GDP growth under the bold stimulus by Japanese government,
— 3,8% in the first quarter and 2.6% in the second quarter.
The economies of other emerging countries, such as India and Brazil, have been slowing significantly since 2012 and are now coping with the decreasing demands of western nations.
Other commodity economies, such as Australia and Canada, also suffer similar problems of less demands by the developed world which affects in turn China.
There remain many dangers. The public debt of the Japan and United States are still increasing. In Japan, the government has announced to increase its sales tax to 10% to control
its debt (largest in the world). In October, the United States is now shadowed with week-long shut down of the federal government and a related political storm about raising the borrowing limit by the government.
It is inconceivable the political situation not be resolved finally, although as every day drags on, the damages to global economy would mount just as IMF warned.
There is a continuing bloody civil war in Syria, public unrest in Egypt and terrorist attacks elsewhere, and territorial disputes among Asian countries
Also the earth has felt the effects of a warming global climate - monstrous storms, floods, extreme weather patterns, and rising sea levels.
Optimism of business communities in Europe could continue to drive Germany, France and the United Kingdom forward to 2014, helping the whole region.
However, the recovery of Eurozone and the United States cannot compensate the sluggish growth of developing nations
which are coping with decreased demands and the capital outflow due to the tapering of U.S. Federal stimulus.
In October, the International Monetary Fund (IMF) just lowered its forecast of the global economic growth, 2.9% for 2013 and 3.6% for 2014.
All in all, the global economy has been not faring too bad so far this year. In the coming months, it should be continuing on a vulnerable and difficult recovery course,
in the absence of any unanticipated and unforeseeable catastrophic events.
The United States and Canada
Recently the forecast of GDP growth of both countries have been lowered for the second half of 2013. The housing sector shows a stable recovery in the U.S. but a lukewarm trend in Canada.
Inflation is low and below 2%, and both employment rates are improving. Therefore, the similarity ends in the financial front. The US stock market is still on a bull run with historical highest indices
(e.g. Dow Jones hovering 15,000). On the other hand, that of Canada dropped from its 2011 peak level of 14,000 level and hanged around 12,000 points since then — especially in the energy and commodity sectors.
| United States | 2012Q1 | 2012Q2 | 2012Q3 | 2012Q4 | 2013Q1 | 2013Q2 | 2013Q3 | 2013Q4 |
| Real GDP(q/q% chng,a.r.) | 3.7 | 1.2 | 2.8 | 0.1 | 1.1 | 2.5 | 1.8* | 2.5* |
| CPI(y/y% change) | 2.8 | 1.9 | 1.7 | 1.9 | 1.7 | 1.4 | 1.5* | 1.4* |
| Unemployment Rate(%) | 8.2 | 8.2 | 8.0 | 7.8 | 7.7 | 7.5 | 7.3* | 7.2* |
| CA Balance($b,a.r.) | -483 | -442 | -427 | -409 | -420 | -396 | -413* | -404* |
| Canada | 2012Q1 | 2012Q2 | 2012Q3 | 2012Q4 | 2013Q1 | 2013Q2 | 2013Q3 | 2013Q4 |
| Real GDP(q/q% chng,a.r.) | 0.8 | 1.6 | 0.8 | 0.9 | 2.2 | 1.7 | 2.0* | 2.3* |
| CPI(y/y% change) | 2.3 | 1.6 | 1.2 | 0.9 | 0.9 | 0.8 | 1.2* | 1.3* |
| Unemployment Rate(%) | 7.4 | 7.3 | 7.3 | 7.2 | 7.1 | 7.1 | 7.1* | 7.0* |
| CA Balance($b,a.r.) | -55.8 | -65.7 | -68.8 | -58.5 | -.53.8 | -58.3 | -58.7* | -57.0* |
| *estimates | ||||||||
Source: BMO Capital Markets Economics (Economic Outlook 9/13/2013 & Forecast Summary 10/4/2013)
The American trade deficit rose slightly to $39.5 billion in August from 39.1 billion in July. The cumulative deficit for the first eight months of 2013 was US$319 billion; the United States has been running consistently a trade deficit since 1980. The Canadian trade deficit also grew in August to C$1.31 billion (US$1.27 billion) from July's C$1.19 billion. From January to August, the total deficit was now $6.98 billion; the second highest record since 2012 for the same period. Canada exports 76% of her exports to the United States, but has a trade surplus with the United States at C$3.99 billion. (Sources: Reuters & tradingeconomics.com).
[ Top | Bottom ] of Page
China
According to IMF, Chinese government may not bolster its economy unless if growth dropped well below 7.5%.
Lower inflation rate is forecast with CPI as 7.4% for 2013 and 6.8% for 2014 (notes: 9.3% in 2011; 7.8% in 2012).
Its trade surplus in US$ billions are: 155.5 (2011), 231.2 (2012), 244.5 (2013) and 250.0 (2014). The following table shows its real GDP:
| 2011Q3 | 2011Q4 | 2012Q1 | 2012Q2 | 2012Q3 | 2012Q4 | 2013Q1 | 2013Q2 | 2013Q3 | 2013Q4 | |
| Year,Quarter | 9.1 | 8.9 | 8.1 | 7.6 | 7.4 | 7.9 | 7.7 | 7.5 | 7.2* | 7.0* |
Note: IMF's GDP estimates: 7.6% (2013) & 7.3% (2014).
Other Economies
Japan
Last year, Prime Minister Shinzo Abe launched an aggressive stimulus program. Japanese economy now picked up sharply and resulted in a spike in GDP by first quarter this year,
modulating a long see-saw recessionary trends. The outlook of Japan is stable and the real GDP growth is forecast 1.4% for 2013 and 1.2% for 2014 (BMO Cap. Mkts Economics, Aug 2013)
Germany
On October 3, Angela Merkel celebrated the 23 anniversary of the German Unity Day after her party won an splendid election (just short of an absolute majority) last September.
The Chancellor is now trying to form a coalition government. No matter how the outcome is. It is likely for her to continue a practical and cautious approach — the remaining
fiscal problems and the direction of the European union. Her management style has helped to end the debt crisis and her government has brought needed stability to the Europe.
The broad domestic demands and solid export trade brought 0.7% growth in August. This year GDP growth is estimated 0.5% for 2013 and 1.7% next year ( DB Research, Focus Germany, Sep 2013).
Eurozone
The largest global economy seems to be still weak but its condition is stabilizing this year with a smaller contraction of 0.4% in GDP (compared to -0.5% in 2012).
There are remaining fiscal and debt problems in some members of the union, but there are guarded optimism in Europe that their economy would reached the bottom of the trough.
The IMF has forecast a 1% GDP expansion for 2014 (IMF, Oct 2013).
| 2012Q1 | 2012Q2 | 2012Q3 | 2012Q4 | 2013Q1 | 2013Q2 | 2013Q3 | 2013Q4 | |
| Eurozone | -0.2 | -0.7 | -0.4 | -2.4 | -1.1 | 1.1 | 0.5* | 0.6* |
| Japan | 4.8 | -0.9 | -3.6 | 1.0 | 3.8 | 2.6 | 1.6* | 1.5* |
| Germany | 2.7 | -0.3 | 0.8 | -1.8 | 0.0 | 2.9 | 2.0* | 2.0* |
Videos of Interest
World Economic Outlook Panel. Sep 2013 (31 min)Davos - The Global Economic Outlook, Feb 2013 (1 hr 18min)
[Previous | Top | Middle Page]
This article is written for personal references only. No advice, nor qualified idea & nor opinion are given; also no accuracy of figures are guaranteed