
The Performance Of Stock Market in the United States and Canada in 2013
Last October, I listened to several speeches at The Money Show (Toronto) about the global economy—all of the speakers
thought the global economy was still in the expansion phase of the business cycle although the pace of growth had slowed down last quarter.
In the recent recession, the trough touched the bottom in June 2009 for the United States (July for Canada). With heavy stimulus by the Federal government,
the unsteady expansion is 52 months or so old. The US economy is now still expanding and there could be many months or years away before it rises another peak.
The span in months from trough to peak for recent long expansion phases were about 106 (1961-1969), 69 (1975-1980), 93 (1982-1990), 120 (1991-2001), and 73 (Nov 2001-Dec 2007).
Before last September the US Federal Reserve had been hinting they might consider reducing the monthly $85 billion buy-back program of federal bonds or the pull back of other stimulus measures. In a surprise announcement at the end of September, they decided to delay tapering of the stimulus until they see stronger economic data. Thus, most economists think the current bond buying program (often called quantitative easing or QE3) could not end and the interest rate would not change at least until the end of 2013.
The equity (or stock) market responded positively to the Fed announcement in late September. All stock indices rose in the United States and Canada. The Dow Jones Industrial Average reached the historical high of 15,683 on October 29 and the S&P/TSX Composite Index rebounded to a 2-year high of 13,455 on October 30 (Figure 1). On Friday, November 1, the closing data were: DOW—15,615.55, SP500—1,761.64, Nasdaq—3,922.04, S&P/TSX—13,337.46, and Nikkei 225—14,201.57.
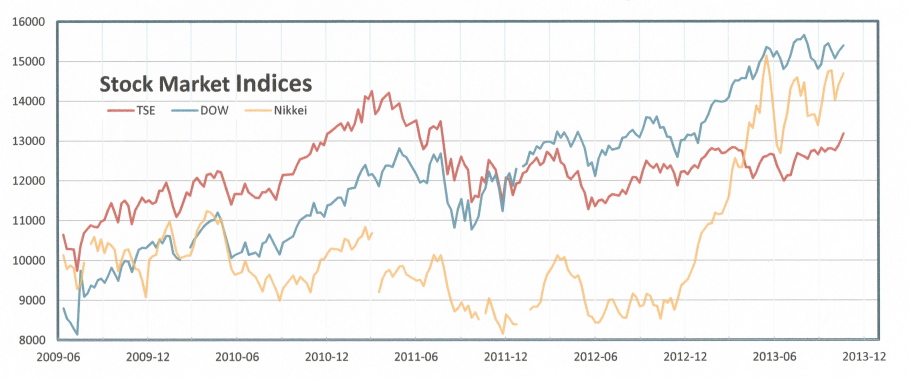
Figure 1. Weekly Closing of The Stock Market Indices — Dow, S&P/TSX, and Nikkei 225 (Tokyo)
Source: Private data base of logging by Gordon Li
Besides interest rate, the market is sensible to the general economic environment and the corporate earnings. Unemployment rate is declining to 7.5% but still not reaching full employment level. I vaguely remembered the Obama administration had suggested an acceptable U.I. rate of 6% or below in 2016 and the Fed Reserve liked a consistent and rising GDP growth of at least 2%.
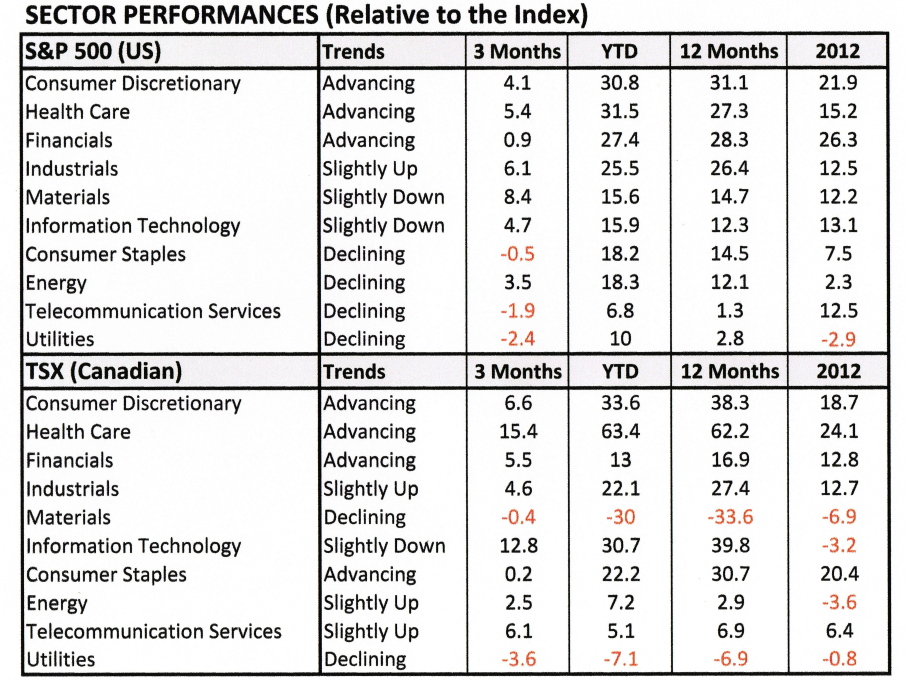
Table 1. The Performances of Sectors in S&P500 and S&P/TSX
Source: Global Equity Weekly (Oct 18, 2013), BMO Capital Markets; Bloomberg
[ Top | Bottom ] of Page
In the first two quarters of 2013, most large US corporations reported strong performances and some hiked their dividend.
The year-to-date performance were: 20.0 for (S&P100 large cap), 26.5 (S&P400 mid cap), 31.2 (S&P 600 small cap) and 22.3 (S&P500).
The annual figures for 2012 were: 13.3, 16.1, 14.8 and 13.4 respectively.
Those performances for Canada were: 5.7 for (S&P/TSX60 large cap), 5.5 (S&P/TSX mid cap), 1.2 (S&P/TSX small cap) and 5.7 (TSX).
The annual figures for 2012 were: 4.8, 1.7, -4.9 and 4.0, respectively. Note that the weightings of S&P/TSX are dominated by financials (35.11%),
energy (24.86%) and materials (12.55%). The bottom are occupied by utilities (1.87%) and information technology (1.62%).
Before the QE3 ends, the decision to go to defense in stock portfolio all depend one's risk tolerance and individual financial situation. Some analysts and managers now advise of a diversified portfolios with slightly higher weightings on blue chips and bank stocks. Some think of smaller weightings on the stocks of emerging markets, while some others suggest the stocks of Western European, e.g. Germany.
If the current expanding fiscal and monetary policies are allowed to continue, the performances of various market sectors would follow the pattern of a normal equity cycle, e.g. consumer growth cyclical is followed by the Industrial and commodity cyclicals in the last stages of recession. Table 1 shows the sector performances for 2013 and 2012. Generally, industry rotation investment portfolio can outperform a buy-and-hold portfolio; however, timing the market is very complicated and difficult task.
Finally, according to many of these experts, the US stocks are now over-valued while those of Canadian stocks are under-valued.
A currency exchange of US$ and Cdn$ chart is included below (Figure 2). Also some of the latest economic data might be skewed by the 16-day shutdown of the
US Government in October.
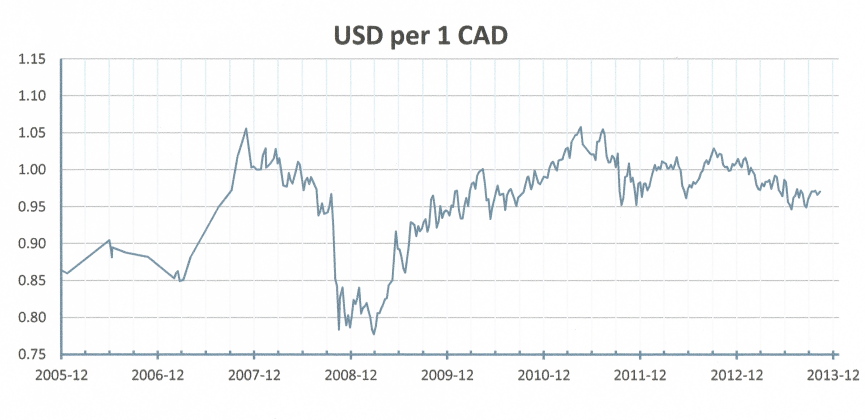
Figure 2. The Historical Chart of weekly US$ and Cdn$ exchange rates between 2005 and 2013
Source: Private data base of logging by Gordon Li
Note: The purpose of the study of the market is carried out for the annual rebalance of portfolio and review of strategies for my own portfolio, and this article is written solely to share information about the market with other investors and traders.
[Previous | Top | Middle Page]
This article is written for personal references only. No advice, nor qualified idea & nor opinion are given; also no accuracy of figures are guaranteed