28 December 2015 (update: 2015/12/31)
Prices and Supply/Demand of Crude Oils
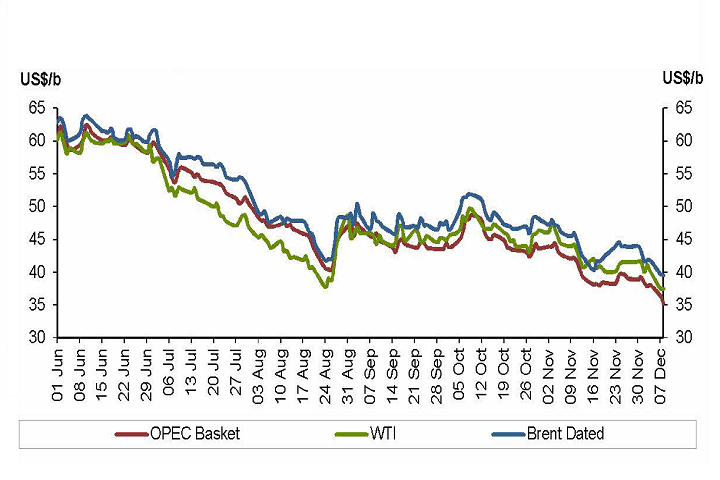
In the first half of 2015, the WTI oil price started from about US$48/b in January, dipped to a low of about $45 in the middle of March and then firmed to around $60 between May and June. In the second half of the year, the price dropped again in July and slid to another low of about $39 by the end of August. The price rose close to $50 in the first week of October, but then it went into a generally declining trend. On Christmas eve, the market price for WTI closed at about US$38/b.
(Source: OPEC Monthly Oil Market Report - December 2015)
The price is important for the oil industry and the oil producing countries; the price affects their revenues and their financial health. Unfortunately, there are many variables in the complex supply/demand equation of the oil market.
According to OPEC's "Monthly Oil Market Report" (December), the price of OPEC Reference Basket crude declined by 10% or $4.52 in November and now stood at $40.50/b. The oil futures also fell, with Brent averaging $45.93/b and WTI $42.92/b. The table below summarizes the balance of supply and demand of world oil in million of barrels per day (mb/d):
| 2013 | 2014 | 2015Q1 | 2015Q2 | 2015Q3 | 2015Q4 | 2015 | 2016* | |
| (a) World oil demand | 90.4 | 91.3 | 92.0 | 92.0 | 93.6 | 93.9 | 92.9 | 94.1 |
| Non-OPEC supply | 54.3 | 56.5 | 57.9 | 57.6 | 57.4 | 57.2 | 57.5 | 57.1 |
| OPEC NGLs and non-conventionals | 5.6 | 5.8 | 5.9 | 5.9 | 6.0 | 6.1 | 6.0 | 6.2 |
| (b) Total supply excluding OPEC crude | 59.9 | 62.3 | 63.8 | 63.5 | 63.4 | 63.3 | 63.5 | 63.3 |
| Difference (a-b) | 30.4 | 29.0 | 28.2 | 28.5 | 30.1 | 30.6 | 29.4 | 30.8 |
| OPEC crude oil production | 30.2 | 30.1 | 30.3 | 31.2 | 31.6 | |||
| Balance | -0.2 | 1.1 | 2.1 | 2.7 | 1.4 |
(Source: OPEC Monthly Oil Market Report - December 2015)
[Top| Bottom ] of Page
Developments in the Oil Market
1. At the December meeting, OPEC failed to compromise on a oil production ceiling for their members, thus the cartel will let the oil market stabilize itself.
On December 4, WTI crude closed at US$39.97/b and on December 18 was 34.73. Some analysts believe the biggest producer in OPEC, Saudi Arabia, chooses to pursue the price-war strategy to regain its declining market shares.
OPEC did not cut their production in December 2014 and the price of crude oil continued to slide since then.
This strategy seems to achieve a degree of success in the second half of 2015 - the producers in North America began to shelve their expansion plans, temporarily or permanently. The new U.S. producers of shale oil who produced not much before 2007 but now contribute all the growth of oil production in the United States.
The following is a figure of one of the 7 key tight oil and shale gas regions in the United States;
the Bakken region (North Dakota Oil) produced 0.13 mb/d in January 2007 and suddenly climbed from 0.40 mb/d in June 2011 to a peak of 1.26 mb/d in December 2014. Now, this region produced 1.13 this December but is sliding to about 1.10 next January.
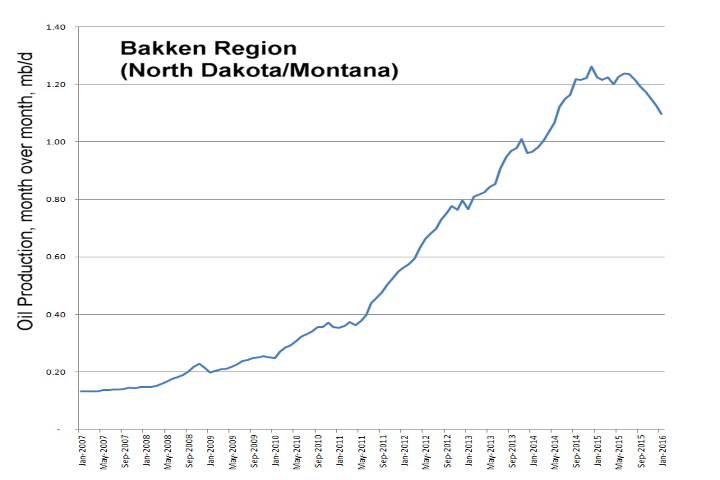
(Data: Drilling Production Report, EIA, Dec 2015)
The total U.S. crude oil production reached a peak of 9.6 mb/d in April 2015, but will continue declining upto September 2016, when the total production averages 8.5 mb/d. Then it may return to the 8.7 mb/d level in late 2016.
2. The US Congress has been discussing to lift the 40-year ban of U.S. oil export last fall,
and the House passed a bill to lift the ban on December 11. Before Christmas, President Obama
signed the trillion spending bill with the attached act of lifting the ban on December 18,
and the U.S. exporters will ship the first cargo next January. In the light of present global oil glut,
the export will not change the current trading figures or total global production,
although the export might let the North American industry manage the crude allocation more efficiently.
Nevertheless, the lighter WTI crude has been trading at a discount against the heavier Brent crude for decades. Suddenly, the price spread between the two crudes disappears; Brent and WTI crude oils are now trading almost at par.
3. In 2015, Iran and the West had agreed to lift the economic sanction on Iran with the condition
Iran not to build nuclear weapon. Iran produced about 4 mb/d before the latest sanction in 2011.
This year Iran produced 2.7 mb/d and exported about 1 mb/d to the world> When Iran returns to the global market in 2016, the oil price should be depressed further, though other OPEC members do not oppose Iran's return.
4. After Saudi Arabia and the United States, Russia is the third largest oil producer in the world.
Because of Ukraine, the West has sanctioned trades with Russia in recent two years. To compensate the loss of revenue, Russia cut its oil price by increasing the volume of oil shipments; Russia has now made good inroads to the Asian market.
5. At the COP21 conference in Paris, 195 countries agreed to
reduce the greenhouse gas emissions with the goal of keeping global warming below 2 degree C.
Carbon dioxide is the chief culprit of global warming, mainly through the combustion of fossil fuels.
The controls on this greenhouse gas are made through the development of renewable energy source
and through the efficiency of using energy to reduce the dependency on fossil fuels, meaning less demand of crudes in the coming years.
6. The continuing strength of U.S. dollar will affect the oil price in a reverse relationship.
For example, half of the oil import to the U.S. is from Canada whose currency is now traded at about 72 cents to one U.S. dollar, so if the Canadian import is calculated by the latest WTI oil price of US$38.0 a barrel, the shipment value is 52.8 Canadian dollars a barrel to the exporter.
Outlook
According to the latest "Short-Term Energy Outlook" report, EIA expects the West Texas Intermediate (WTI) crude oil price to range from US$30/b to US$63/b in 2016 (at the 95% confidence interval), considering the current values of futures and options contracts for March 2016 delivery. EIA also forecasts that Brent crude oil price averages $53 in 2015 and $56 in 2016, while WTI crude averages $49 in 2015 and $51 in 2016 (Fig 3).
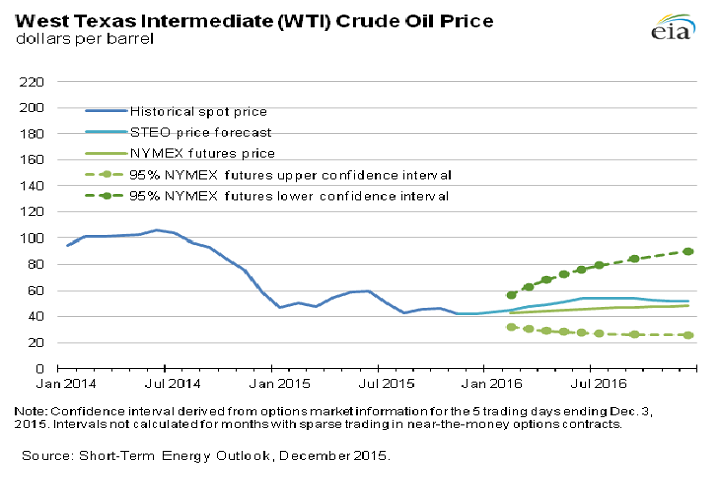
(Source: EIA Short-Term Energy Outlook December 2015
On the other hand, OPEC estimates the global demand for OPEC crude in 2015 was at 29.4 mb/d, an increase of 0.4 mb/d over last year. The demand for OPEC crude is forecast at 30.8 mb/d for 2016, an increase of 1.5 mb/d over 2015. The following table is a quarterly supply/demand estimates for 2016:
| 2015 | 2016Q1 | 2016Q2 | 2016Q3 | 2016Q4 | 2016 | |
| (a) World oil demand | 92.88 | 93.28 | 93.31 | 94.77 | 95.15 | 94.13 |
| Non-OPEC supply | 57.51 | 57.05 | 56.92 | 56.98 | 57.60 | 57.14 |
| OPEC NGLs and non-conventionals | 5.99 | 6.14 | 6.14 | 6.16 | 6.21 | 6.16 |
| (b) Total supply | 63.50 | 63.18 | 63.05 | 63.14 | 63.81 | 63.3 |
| Difference (a-b) | 29.38 | 30.10 | 30.26 | 31.63 | 31.35 | 30.84 |
Closing Remarks
Most analysts anticipate the continuing volatility of oil price in the future months but firmer prices in the second half of 2016. Last September, the U.S. investment bank Goldman Sachs released an analytical report on crude oils that forecast a projection for WTI is US$45/b for 2016 and US$60/b for 2017. The report also mentioned a worst-case scenario of US$20/b - likely because of the weak global economy and the persistent glut in the market.
Update:
(Dec 31, 2015)
1. Note - the forecast of crude oil price was estimated before the benchmark crudes WTI and Brent are trading within the current very narrow spread.
2. At 2:20 pm EST on December 31, 2015, the oil prices were 36.60 for WTI and 36.46 for Brent crude.
3. Saudi Arabia posts a huge deficit of 367 billion riyals (US$98/b) in the 2015 budget and anticipates deficit of $US87b for 2016. Their oil revenues accounted for 72% total revenues of US$162b in 2015 in comparison to the 90% average in the past 10 years. The Saudis had withdrawn its reserves and issued domestic bonds to finance the budget; its reserves dropped from US$732b in December 2014 to at the end of 2014 to US$628b last November. (http://news.yahoo.com/saudi-2016-growth-dive-debt-rises-reserves-drop-093420575.html?soc_src=copy )
4. On December 31, Iran denied fired launched rockets near a U.S. aircraft carrier in the Gulf last Saturday and said the United States planned new sanctions over Iran's new ballistic missile program.
No accuracy of figures or information are guaranteed. The writer and The Site hereby disclaim all liability for the use of this page.